
Enterprise AI Unit Economics: How to Measure, Benchmark, and Reduce AI Costs
The number that matters in a consumption-priced AI deployment is the cost of a single query. This guide covers how to define cost per query across different architectures, how to benchmark it, and how to use it in procurement decisions.

One of the most useful metrics in consumption-priced AI deployments is the cost of a unit of work. In some workflows that unit is a query. In others, it may be an agent run, a document processed, a workflow execution, or a resolved task. Whichever unit fits, tracking it produces something that total spend alone does not: a per-unit number that can be compared across vendors, tracked over time, and presented to finance in terms that move the conversation from "the AI bill keeps growing" to "the per-unit cost has fallen and volume has doubled, so here is what the next budget looks like."
Most enterprise AI deployments do not have this number. They have an invoice total, a usage volume, and an implicit assumption that dividing one by the other produces something meaningful. Sometimes it does. Often it does not, because the unit being measured varies across workflows, and because the cost components included in that unit are not always defined consistently.
AI spend behaves differently to traditional SaaS. Cost scales with usage, architecture choices, prompt design, retrieval patterns, and workflow complexity. As deployments grow, many organisations can explain total spend but cannot explain why spend changed, which workflows drive it, or whether rising costs reflect growth, inefficiency, or vendor pricing changes. Procurement teams increasingly face this challenge because AI contracts are shifting from fixed-price software models toward variable consumption models, where architecture decisions directly affect commercial outcomes. Unit economics exist to answer those questions.
This article is written for procurement, finance, and IT leaders in Australian organisations managing consumption-priced AI deployments. It covers how to define AI unit economics across different architectural patterns, how to benchmark them, and how to use them to support procurement decisions. Application of these methods depends on system architecture, vendor terms, and internal cost structures, and is best validated within each organisation's own environment. It is intended to inform internal evaluation frameworks, not replace organisation-specific financial or legal assessment. It belongs inside the broader enterprise AI pricing vs total cost of ownership framework, and it builds on the cost mechanics established in enterprise AI API pricing and token costs.
What are unit economics? Unit economics refers to measuring cost, value, or profitability at the level of a single unit of work. The purpose is to understand how costs scale, compare alternatives, and assess whether each unit of work creates enough value to justify its cost.
Choosing the unit of work. Different AI workflows require different units of measurement. Some workflows are naturally measured per query or model call. Others are better measured per document processed, workflow execution, resolved interaction, or agent run. Throughout this article, references to cost per query apply where query-level measurement is appropriate, but the broader principle is measuring cost against the unit of work that creates value.
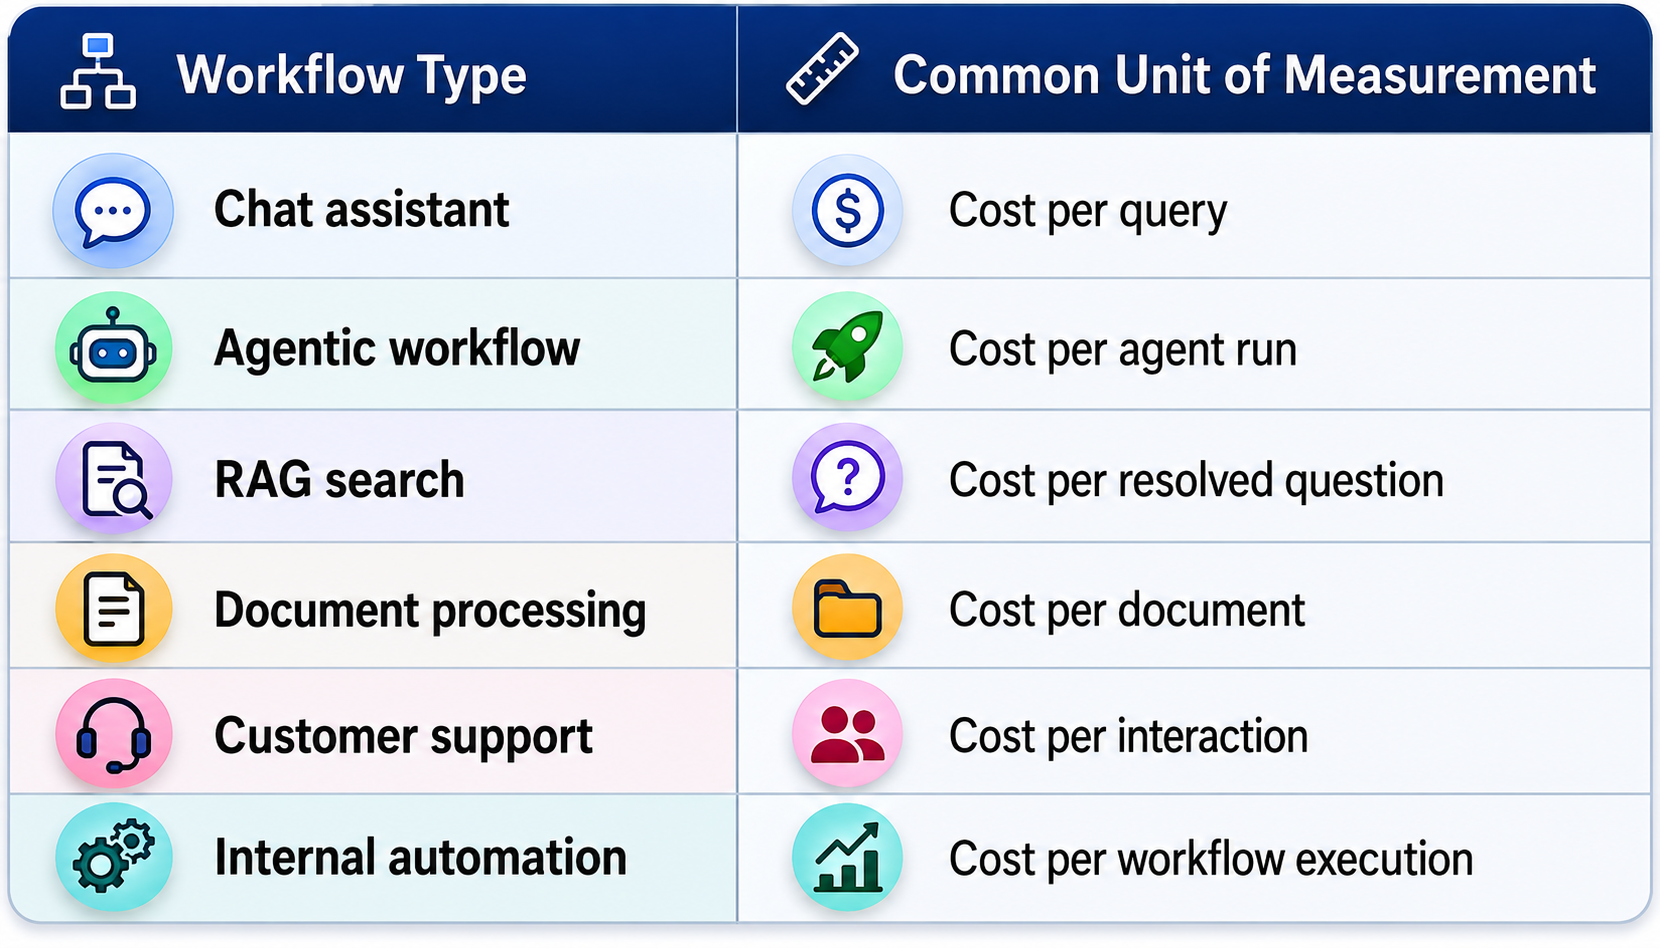
Why Unit Economics Matter
Unit economics are what make AI spend transparent at the finance and executive level. Volume metrics show usage. Total spend shows scale. Neither answers the question that matters: is each unit of work being delivered at a cost that justifies the value it produces.
Without a per-unit number, several procurement and operational decisions become harder to make rigorously. Vendor comparisons collapse to headline rate comparisons that ignore how pricing composes into a delivered unit of work. Build versus buy decisions cannot be evaluated on cost grounds because the two paths often produce different unit cost profiles, and only the per-unit number captures the difference. Renewal negotiations have less data to work with, because volume growth and total spend growth do not separate good news (more usage at lower per-unit cost) from bad news (more usage at constant or rising per-unit cost). And capacity planning becomes guesswork, because the input that would ordinarily drive forecasting is not being tracked.
A well-supported unit cost metric, calculated consistently and tracked over time, informs procurement and budgeting decisions across each of these areas. Once instrumentation exists, maintaining unit economics is often lower effort than many other governance controls. The work is in the definition, not the ongoing calculation.
When Unit Economics Matter Most
Unit economics tend to become more valuable when AI spend is consumption-based rather than fixed-price, when multiple workflows or business units share the same platform, when agentic workflows introduce cost variability, when spend is growing faster than forecast, when procurement teams are approaching renewal or vendor selection decisions, or when finance teams require forecasting confidence. Smaller or low-volume deployments may not require this level of instrumentation.
Defining the Unit of Work
The reason most organisations do not have a meaningful unit cost metric is that defining the unit of work is harder than it looks. A chat prompt, a document classification, an agent run involving three tool calls, and a retrieval-augmented workflow that feeds five documents to a model all carry different cost profiles. Calculating a single number across all of them is mathematically possible but often operationally unhelpful, because the workloads being averaged are not comparable.
A common approach is to define unit economics at the workflow level, not at the platform level. Each workflow has its own definition of what constitutes a unit of work, its own cost components, and its own economic measure. The platform-level total is the sum of the workflow-level totals. The platform-level rate is often uninformative on its own.
For each workflow, the definition typically specifies three things. What user-facing event counts as one unit of work. What backend operations are included in the cost of that unit. And what excluded costs are tracked separately so they do not distort the unit cost view.
The third element is the one most teams miss. Each unit of work has direct costs and indirect costs (the storage, retrieval infrastructure, monitoring, and governance overhead that supports it). Direct costs generally scale with the unit of work being measured. The indirect costs grow more slowly but are not purely fixed. Vector database retrieval fees, for instance, scale with retrieval traffic, and storage costs grow with index size. Reporting all costs as if they scale linearly with the unit of work produces misleading economics. A practical method is to track direct cost per unit of work and surface indirect cost separately, with a clear allocation method when totals are needed. Common allocation approaches include distributing shared costs proportionally by workload volume, token consumption, or revenue attribution. The choice of method affects the final number, which is why documenting the allocation basis is as important as documenting the exclusion list.
Cost Components Across the Three Architectural Patterns
The frameworks and methods described below are illustrative and general in nature. Every organisation's cost structure, vendor terms, and operational context are different. Any methodology is best adapted with input from internal finance, legal, and technical stakeholders.
The cost components that make up a unit of work depend on the architecture. The relative weight of these cost categories varies depending on architecture, integration depth, and how the deployment has been implemented. The architectural distinctions introduced in knowledge graph vs LLM vs RAG are relevant here, because each pattern produces a different cost shape.
Pure Large Language Model
A query is a single model call. The cost components are the input tokens (the prompt and any user-supplied context), the output tokens (the model's response), and any reasoning tokens for models that bill them separately. The calculation is straightforward: tokens at the relevant rates, summed.
The per-query number for a pure LLM workflow is highly sensitive to prompt design. Long system prompts, repeated context, and verbose user inputs all increase input tokens. Verbose responses increase output tokens. Workflows that have not been optimised for token efficiency can pay significantly more per query than necessary, on the same underlying capability.
The procurement implication is that pure LLM unit cost is a measure of both the rate and the workflow design. Comparing two vendors at the rate level without controlling for prompt design produces misleading results.
Retrieval-Augmented Generation
A query in a RAG workflow involves a retrieval step, a model call with the retrieved context, and any post-processing. The cost components are the retrieval infrastructure cost (which may be smaller than inference cost but scales with retrieval frequency and requires optimisation to remain manageable), the input tokens of the model call (which include the retrieved documents and so are typically larger than pure LLM workflows), and the output tokens.
The per-query number for RAG is sensitive to retrieval scope. Workflows that retrieve too aggressively pay for input tokens on documents the model did not need. Workflows that retrieve too narrowly produce lower-quality answers, which tends to drive follow-up queries, raising the effective cost per resolved question.
In practice, some teams find it more informative to measure RAG cost per resolved question rather than per model call. This is not yet a widely standardised metric, but the logic is straightforward: a workflow with a higher cost per call but a lower cost per resolved question may be producing better unit economics, regardless of what the per-call number suggests.
Agentic Workflows
A query in an agentic workflow involves multiple model calls, often with tool use, sometimes with retries and self-correction. The cost components include every model call in the chain, every tool call that has its own cost, and any retrieval or storage costs along the way.
The per-query number for agentic workflows has the highest variance of the three patterns. The same user-facing query can take three model calls or fifteen, depending on what the agent encounters. Average cost per query is a useful starting metric, but it is often paired with a distribution view: what is the median cost per query, what is the 95th percentile, and what is the worst case in the historical data. Workflows where the distribution is heavy-tailed produce cost surprises that the average obscures.
The procurement implication is that agentic workflows typically benefit from a cost ceiling per unit of work to be operationally manageable. Without one, an outlier run can consume disproportionate budget. The variance between forecast and actual cost is often material for agentic workloads, and recent vendor pricing shifts, including moves from bundled token allowances to separate per-token billing, have made per-query tracking more important rather than less.
Calculating the Number
A transparent and evidence-based unit cost metric, for any of the architectures above, requires four inputs.
The relevant rates from the vendor contract, broken out by model tier, by token type (input, output, reasoning, cached), by tool call, and by any other billable units the contract specifies. These come from the contract and the vendor's published pricing, validated against actual invoice data. Rates are not static. Vendor repricing, model tier changes, and mid-term pricing restructures all affect the unit cost number and, in practice, are better treated as a variable input rather than a fixed one.
The actual usage telemetry, at the granularity needed to map each user-facing interaction or unit of work to its underlying calls. This requires platform telemetry, instrumented from the start of the deployment. Ownership and portability of usage telemetry, prompt libraries, and workflow configurations varies materially by vendor and contract structure, and is not always guaranteed. Customers who try to reverse-engineer unit costs from monthly invoices typically cannot, because invoices aggregate at a level too coarse to attribute. Some vendors offer usage logs that, when combined with application-side telemetry, can support unit cost reconstruction, but the customer's own instrumentation remains the primary source for reliable attribution.
The unit-of-work definition itself, applied consistently. Without a stable definition, the number drifts as workloads change, and the trend over time becomes uninterpretable.
The exclusion list. Indirect costs, including infrastructure, governance, and support, tracked separately. In practice, the exclusion list is typically documented and published, so that anyone reading the unit cost number knows what is and is not in it.
With these four inputs, the calculation is mechanical. The output is a number per workflow that can support trend analysis over time and, with sufficient normalisation, vendor comparison.
An Illustrative Example
The figures below are hypothetical and intended only to illustrate how unit economics decompose at the workflow level. Actual costs vary by vendor, architecture, and deployment.
Consider a customer support workflow processing 100,000 interactions per month. With unit economics instrumented, the cost structure might decompose as follows:
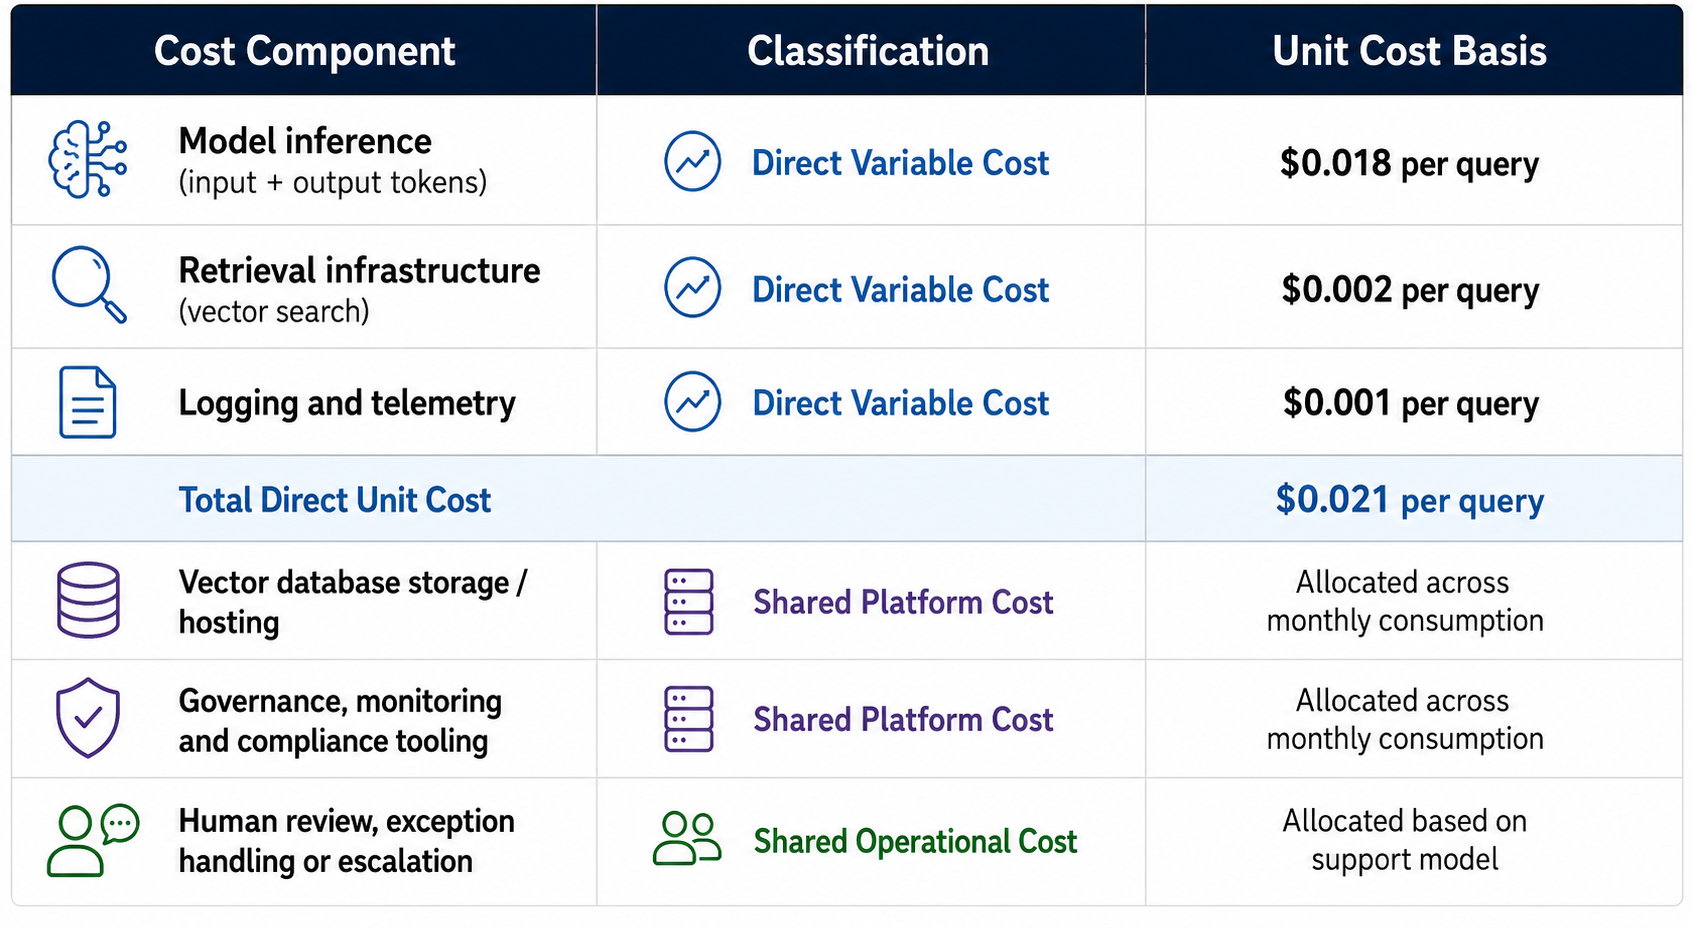
In many implementations, the distinction is that direct costs scale proportionally with workload volume, while excluded costs are shared or fixed-period overheads that do not move linearly with each interaction. Organisations may draw this line differently depending on their cost structure and reporting needs.
With this view, monthly spend growth can be separated into volume growth, unit cost movement, and architecture changes. Without it, the organisation sees only total spend, and cannot distinguish whether a rising bill reflects more usage, less efficient workflows, or a vendor pricing change.
How to Benchmark Unit Economics
Benchmarking unit economics is harder than benchmarking other metrics, because public data is sparse, methodologies are not yet standardised, and direct comparisons are rarely like-for-like. Internal trend tracking is typically the most reliable starting point. Three approaches can produce useful signal.
Internal benchmarking. Track unit cost for each workflow over time, and treat the trend as the primary signal. A workflow whose unit cost is falling typically indicates improving efficiency. A workflow whose unit cost is flat or rising despite optimisation work generally reflects either a usage pattern shift or a platform pricing shift, both of which are worth investigating.
Cross-workflow benchmarking. Compare unit costs across workflows that solve similar problems. Two retrieval-shaped workflows with similar architectures, retrieval patterns, and output requirements may have comparable cost ranges. A large divergence may indicate a design issue worth addressing, rather than a feature of the use case.
Vendor comparison. When considering an alternative vendor, request the data needed to model the same workflow on the alternative platform: rates, model behaviours, included caching, tool use cost, and any platform-specific overhead. The comparison is often more meaningful at the unit cost level than at the headline-rate level, because it captures the architectural differences that headline rates do not.
Industry benchmarks exist for some workflow categories but are often better treated as orientation than as a target. The variance across organisations on the same nominal workflow can be large enough that another organisation's number is seldom a useful target for yours. Direct comparisons across organisations are rarely like-for-like due to differences in data, architecture, and usage patterns.
Using Unit Economics in Procurement
The number is most useful when it is fed back into the procurement process. The following areas are commercial considerations, not contract drafting guidance. Several procurement decisions become more rigorous when supported by unit economics data.
Vendor selection. The enterprise AI vendor evaluation scorecard becomes more rigorous when cost is evaluated using workflow-appropriate unit economics rather than headline rates. Vendors who look expensive on a rate basis sometimes deliver lower unit costs because of caching, batch options, or model routing capabilities. Vendors who look cheap on a rate basis sometimes deliver higher unit costs because their architecture forces higher token consumption.
Build vs buy. The enterprise AI build vs buy decision is more honest when both paths are costed using the same unit of work. Build paths often have higher fixed costs and may have lower marginal costs at scale. Buy paths often have the opposite, although this varies materially by architecture and vendor model. The crossover point depends on volume, and the crossover is visible in unit economics in a way it is not in total spend.
Renewal preparation. Renewal negotiation is materially stronger when the customer brings workflow-level unit cost data with historical trends. The conversation shifts from the vendor's framing of total spend to the customer's framing of unit economics. Customers with this data may find themselves better positioned in those conversations.
Business case maintenance. The original enterprise AI business case typically projects total cost. Unit economics, tracked over time, are the metrics that let the business case be updated honestly as the deployment matures. Forecasts that do not update with unit economics drift from reality.
What Procurement Teams Often Get Wrong
Three patterns recur in organisations that try to use unit economics and find them less useful than expected.
The first is calculating it at too coarse a level of granularity. A platform-wide unit cost that averages across chat workflows, document classification, and agent runs is a number that tells finance very little. The number often becomes most useful when decomposed to the workflow level.
The second is excluding too much. A unit cost metric that excludes everything except direct model spend overstates the efficiency of the deployment. The exclusion list is typically documented, and the indirect costs tracked alongside, so that the full picture is visible even when the unit cost number is intentionally narrow.
The third is tracking unit cost without tracking unit value. Cost on its own does not justify a deployment. The same number is excellent or terrible depending on the value the output produces. Workflows that lower their unit cost while degrading the value of the answer are getting cheaper at the wrong thing. The metric is best assessed alongside an output quality measure.
What Rising Unit Costs Typically Signal
A unit cost metric that is trending upward, after controlling for deliberate changes in scope, often points to one of several patterns. Prompt bloat, where system prompts and context windows grow over time without review. Retrieval scope creep, where RAG workflows retrieve more documents than the model needs because retrieval logic has not been recalibrated since initial design. Model tier drift, where queries that were originally routed to budget-tier models have migrated to premium-tier models, sometimes through vendor default changes rather than customer decision. And vendor repricing, where the underlying rates have shifted mid-term or at renewal. Each of these is addressable, but only if unit costs are being tracked at the granularity needed to distinguish them. The model routing considerations covered in enterprise AI spend caps and budget controls interact directly with unit cost trends, and the two are often reviewed together in practice.
Cost Optimisation Levers That Change Unit Economics
Once unit economics are being tracked, the question shifts from measurement to management. Several levers are available, and their commercial significance is growing as vendors build them into platform pricing and competitive positioning.
Prompt caching. Many vendors now offer caching for repeated prompt prefixes, system prompts, or context blocks. When the same system prompt is sent across thousands of queries, caching avoids re-processing those tokens on every call. The cost reduction on input tokens can be substantial for workflows with long, stable system prompts. Whether prompt caching is included, how it is priced, and whether the cache behaviour is transparent in usage telemetry are increasingly common evaluation questions.
Semantic caching. Some platforms cache not just identical prompts but semantically similar queries, returning a previous response when the new query is close enough to one already answered. This reduces both cost and latency, but introduces a quality trade-off: the threshold for "close enough" determines whether the cached response is appropriate. The similarity threshold, whether it is configurable, and how cache hit rates are reported are often material to the commercial evaluation.
Model routing. Directing different query types to different model tiers based on complexity is one of the most effective cost levers available. Simple classification tasks routed to a budget-tier model cost a fraction of what they would on a premium-tier model, often with no meaningful quality difference. More complex queries route to higher-capability models where the cost is justified. Routing logic can be rule-based, model-based, or a combination, and is increasingly offered as a platform feature rather than a custom build.
Context window management. Workflows that send more context than the model needs pay for tokens that produce no value. Retrieval-augmented workflows are particularly sensitive to this: retrieving five documents when two would suffice doubles the input token cost without improving the answer. Regular review of context window utilisation, particularly after the initial design phase, is one of the simplest optimisation actions available.
Each of these levers changes the effective unit cost. Vendors increasingly market them as differentiators, and in many cases they are genuine. Evidence of cost impact in comparable deployments is often more informative than the claimed reduction at face value. The unit cost metric, tracked before and after an optimisation is applied, is what makes these claims testable.
Why This Number Pays Back
A well-calculated unit cost metric is the input that can help convert AI spend from a budget anxiety into a manageable operational metric. It supports vendor selection, build versus buy decisions, renewal negotiations, and ongoing capacity planning. It produces a finance conversation grounded in unit economics rather than in total spend.
Defining unit economics typically requires procurement, finance, engineering, and platform stakeholders. Instrumentation, however, generally requires engineering input, because mapping each user-facing interaction to underlying API calls, tool invocations, and token counts typically involves logging infrastructure that many vendors do not provide out-of-the-box. Once established, the ongoing effort is modest: trend tracking is a monthly review, run by a named owner. But the initial setup is often more substantial than expected, particularly in environments where telemetry has not been instrumented from the start.
Organisations that do this work typically have more usable unit economics. Organisations that do not often default to invoice-level visibility. The difference in negotiating posture, in operational governance, and in long-term cost trajectory is large, and it compounds across every renewal, every vendor decision, and every business case the organisation runs over the lifetime of the deployment.
This article provides general commercial and procurement commentary only and does not constitute legal, financial, or professional advice.